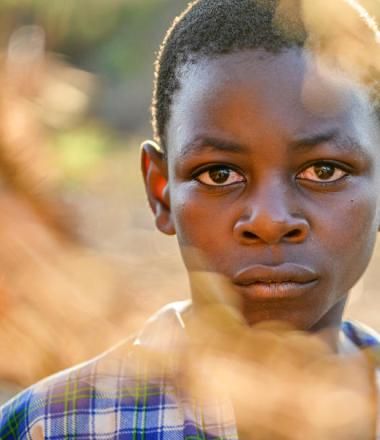
How much are countries spending to end violence against children?
Every year, more than one billion children – or half of the world’s children – experience some form of violence. Exposure to violence compromises a child’s mental and social development, hampers educational outcomes and reduces opportunities for gainful employment. It is estimated that physical, sexual and emotional violence against children costs societies 3% to 8% of global GDP.
In 2017, World Vision commissioned Counting Pennies, a review of ODA to identify how much international aid was spent to end violence against children. This initial review of 2015 data revealed that despite a series of global commitments, less than 0.6% was going toward ending violence against children.
Since then, several countries have committed to accelerate progress in ending violence against children. However, progress has been slow and further undermined by the outbreak of COVID-19. It is estimated that risks of violence against children have increased by 32% because of the pandemic. At the same time, UNICEF estimates that 80% of services to address violence against children have been disrupted due to the pandemic. Ensuring that prevention and response to violence against children is high on the political agenda is critical to meet the new challenges and sustain progress.
Embedded below are the interactive data findings from our second and third review of ODA. We found that in 2018, the total ODA spending towards EVAC was just US$ 1,886.5 million – or 0.96% of total ODA spending.
With looming economic crisis, reduced capacity of governments and other stakeholders to respond to and prevent violence against children remains one of the central concerns for policymakers and practitioners. It is therefore critical to examine the latest trends in the ODA spending on ending violence against children, their implications, and potential solutions to ensure that level of ODA remains adequate to support achievement of violence against children related SDG targets.
For this latest iteration of the report, we've made as much of the data as possible interactive and dynamic. Please click through the data sets below to filter and highlight different elements by theme, country, donor, etc.


